Implement your own clustering method
You can also define your own clustering method by extending the sklearn.base.ClusterMixin and sklearn.base.BaseEstimator classes:
# Prerequisites
import numpy as np
import matplotlib.pyplot as plt
from toad import TOAD

plt.rcParams["figure.dpi"] = 300
plt.rcParams["figure.figsize"] = (12, 5)
td = TOAD("test_data/garbe_2020_antarctica.nc", time_dim="GMST")
td.data = td.data.coarsen(x=2, y=2, GMST=2, boundary="trim").reduce(np.mean)
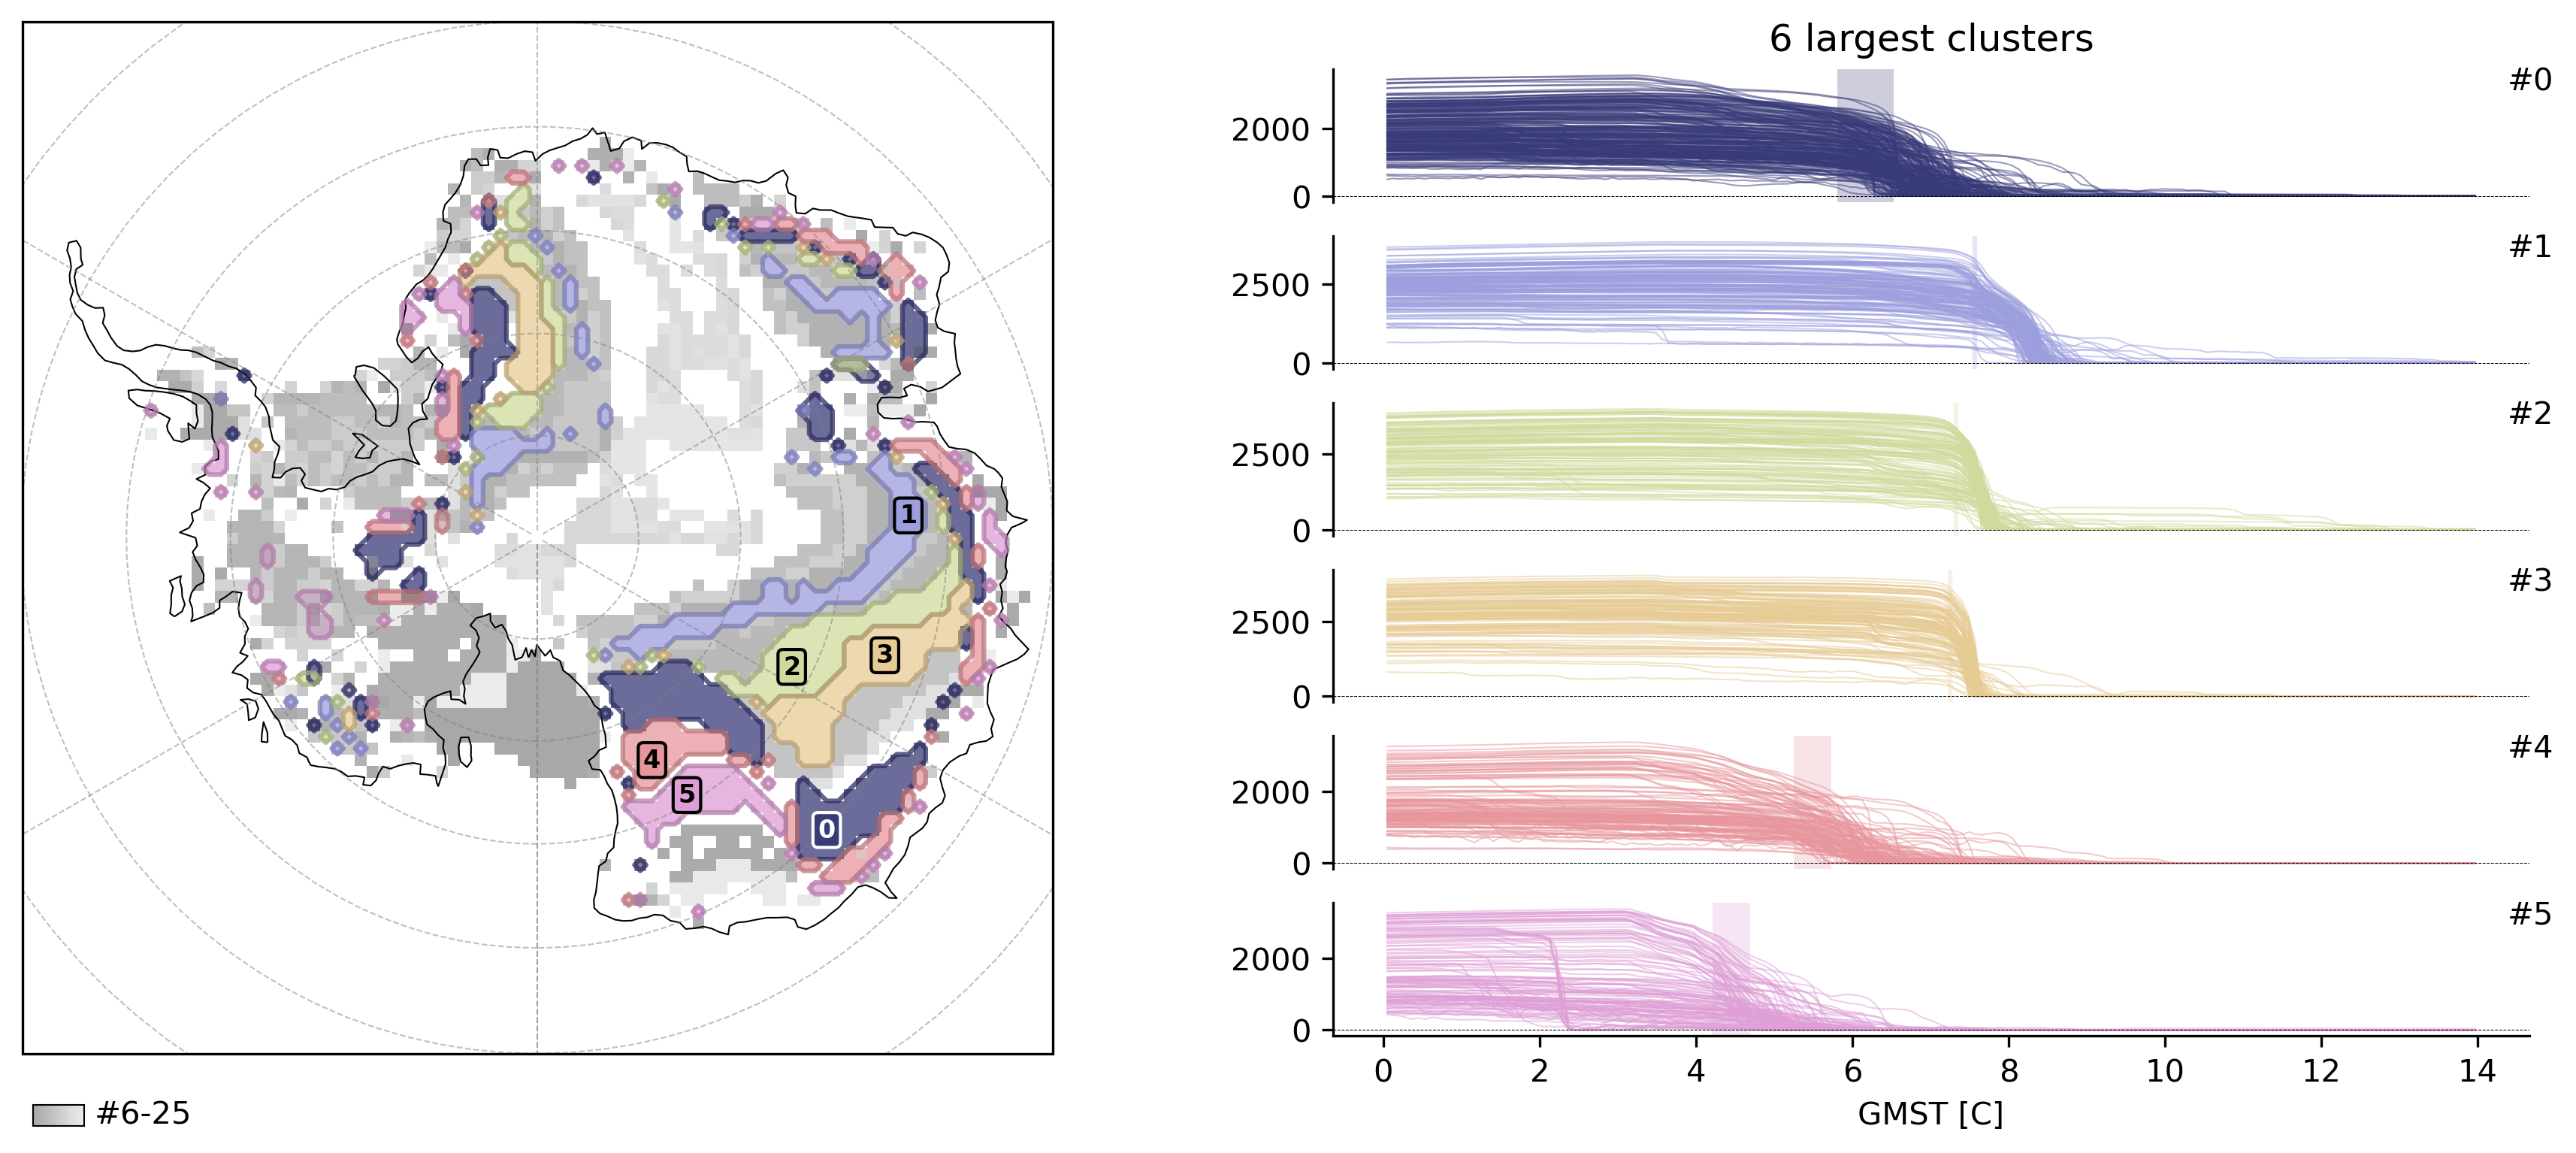
Here is an example of a custom clustering algorithm: specifically we still use HDBSCAN but instead of clustering abrupt shift events in space-time, we cluster in a space of detection signal (y) and timing only, which consequently highlights regions that shift with the same intensity at the same time.
from sklearn.base import BaseEstimator, ClusterMixin
from sklearn.cluster import HDBSCAN


class ExampleClusterer(ClusterMixin, BaseEstimator):
    # you can pass parameters to your method like
    def __init__(self, scale_factor=1.0):
        self.scale_factor = scale_factor

    # required method
    def fit_predict(self, X: np.ndarray, y=None, **kwargs):
        # X = coords (time, x, y, z)
        # y = weights / detection signal

        #
        # Here you can then do whatever you want, just make sure to return a numpy array of labels, with -1 = being noise, clusters = 0, 1, 2, ...
        #

        # in TOAD, y is the detection signal and never None, but for type checking we check for it
        assert y is not None, "y must be provided"

        # optionally scale y
        y = y * self.scale_factor

        # create new data array with time and y
        data = np.column_stack((X[:, 0], y))

        labels = HDBSCAN(min_cluster_size=50).fit_predict(data)
        return labels


td.compute_clusters(
    "thk",
    method=ExampleClusterer(
        scale_factor=1.0,
    ),
    shift_threshold=0.5,
    overwrite=True,
)
INFO: New cluster variable thk_dts_cluster: Identified 26 clusters in 3,377 pts; Left 29.0% as noise (979 pts).
td.plot.overview(td.cluster_vars[-1], map_style={"projection": "south_pole"});